Rapid U-value calculation using Heat3D

How to obtain the U-value of building elements

Heat3D uses Apple ARKit to detect walls and construct a thermal model of a room. Infrared thermal imagery and results are projected onscreen to give an immersive experience allowing inspection of the thermal properties both in real-time and at a later date.

Process for carrying out a U-value survey with Heat3D

  1. Setup equipment

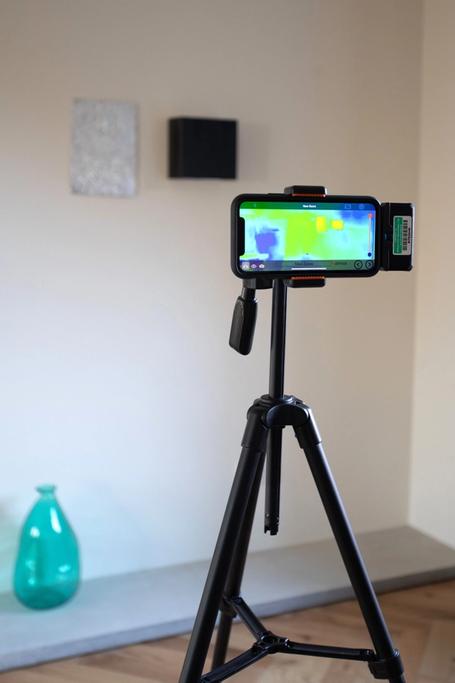
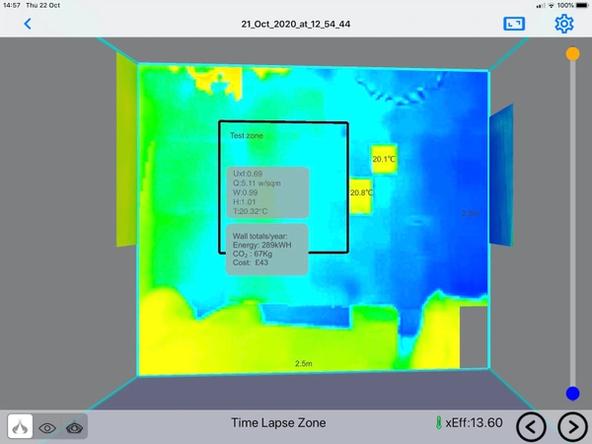
    Heat3D uses specialist targets to measure the ambient and reflective temperatures within the room which are mounted next to the wall being surveyed.

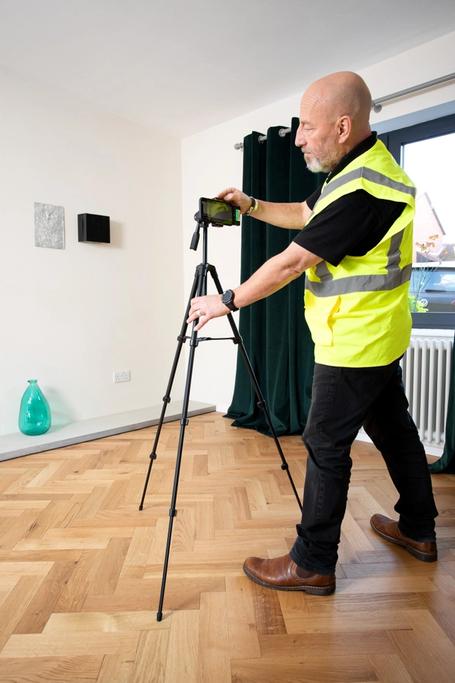
    To measure U-values, the iPhone or iPad is attached to a tripod so that it can be left in place to perform the survey in an automated way over the course of 1 hour.

    Heat3D targets on a wall
    Heat3D app pointing at a wall
  2. Establish the floor plane

    The Heat3D app uses Apple ARKit to construct a 3D model of the room. Firstly, the floor location must be established by pointing the camera at the floor.

    A grid will be displayed on-screen in an augmented way confirming the horizontal plane that the floor exists on.

    Apple ARKit floor detection
  3. Create 3D model of room

    Secondly, a 3D model of the room is captured to construct a virtual model that IR images can be projected onto and shown on-screen.

    Go round the room pointing the iPhone or iPad at the corner junctions where the wall meets the floor. Rooms can be any shape and have as many corners as are required.

    3D model of room
  4. Capture infrared thermal images of wall

    With the room model constructed and all equipment set up, a Heat3D survey can be started. A survey takes 45 minutes to complete, capturing infrared thermal images of the wall every 1 minute. In order to generate sufficient heat flux to be measured accurately, a minimum internal-external temperature difference of 10oC is recommended.

    At the end of the survey, the U-value and heat flux (Q) can be viewed for the entire wall or certain test zones that you are interested in.

    Heat3D thermal image capture
  5. View reports

    The Heat3D app will present an animated time-lapse of the IR images captured showing how the survey progressed.

    All results are uploaded to a secure cloud-based portal where charts can be viewed of temperature, heat flux and U-values over the course of the survey. Test reports can then be generated and presented to the client.

    Heat3D website

Header